中文
Home
Research
Projects
RUSH
Publications
Publications
Copyrights
Awards
Team
Leader
All Faculty
Seminar
Contact
PROJECTS
HOME
>
PROJECTS
>
快照超光谱三维显微技术
Snapshot Hyperspectral Volumetric Microscopy
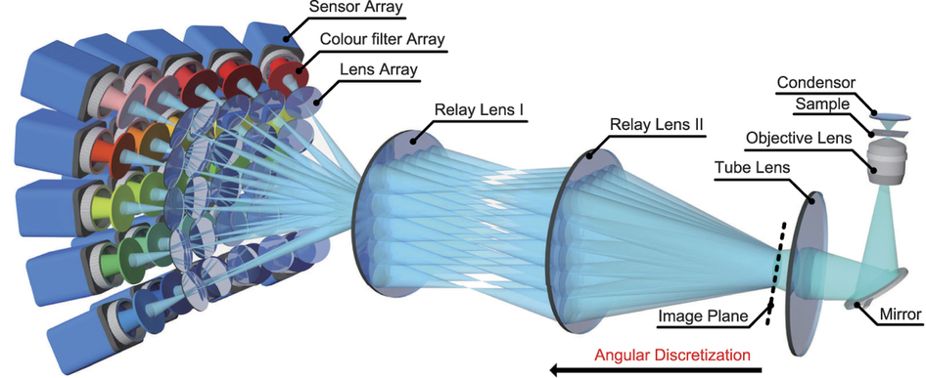
## Snapshot Hyperspectral Volumetric Microscopy ### Introduction The comprehensive analysis of biological specimens brings about the demand for capturing the spatial, temporal and spectral dimensions of visual information together. However, such high-dimensional video acquisition faces major challenges in developing large data throughput and effective multiplexing techniques. Here, we report the snapshot hyperspectral volumetric microscopy that computationally reconstructs hyperspectral profiles for high-resolution volumes of ~1000 μm × 1000 μm × 500 μm at video rate by a novel four-dimensional (4D) deconvolution algorithm. We validated the proposed approach with both numerical simulations for quantitative evaluation and various real experimental results on the prototype system. Different applications such as biological component analysis in bright field and spectral unmixing of multiple fluorescence are demonstrated. The experiments on moving fluorescent beads and GFP labelled drosophila larvae indicate the great potential of our method for observing multiple fluorescent markers in dynamic specimens. > Wu, J., Xiong, B., Lin, X., He, J., Suo, J., & Dai, Q. (2016). [Snapshot Hyperspectral Volumetric Microscopy.. Scientific Reports](https://www.nature.com/articles/srep24624), 6(1), 24624-24624. ### Highlights  #### Color filter array - (a) The position for each colour filter to be mounted. - (b) The spatial layout of the colour filter array. - (c) The spectral responses of the colour filters.  #### Hyperspectral volumetric imaging in bright field - (a) Different slices of the synthetic RGB volume for the volvox sample, by integrating the reconstructed hyperspectral data with colour response curves of PointGrey Flea2-08S2C-C. - (b) Images of a selected depth (z = 30 μm) at several equally spaced spectrum channels for the volvox sample. - (c) Spectrum profiles of the selected points in (a). - (d) Comparison of the spectrum curves between ground truth (transmission data of the laser line filer with only 1nm FWHM) and the reconstruction with its gaussian fitted curve. FWHM, full width at half maximum measurement.  #### Light field video With the captured light field video of a living drosophila larva (first row), the 3D differential phase-contrast (DPC) video pair is computed (second and third rows) for recovering the phase video (forth row) which represents sample’s optical path length (e.g. height).